
Chances are, Statistics 1 has never been as useful – or amusing – as Mark Kayser's class.
"Here’s a question that’s probably been on your mind,” Professor Mark Kayser says to a class of public policy students at the Hertie School one late October morning. “Is the Bible the literal word of God – or was it created by man?”
No, this isn’t a lecture on religion or philosophy, although this course does give students the tools to answer some big questions in an era of Big Data. It’s ‘Statistics 1’, a core course nearly all Hertie School students take – a popular requirement with some serious entertainment value.
Carolina Matamoros Ferro from Colombia, a first-year student in the Master of Public Policy programme, says: “What has surprised me most is the way Kayser shows things in common language, how he engages people with the different anecdotes.” She says this even though she calls herself “an outlier” and “not part of the mean” because she has worked extensively with statistics.
Whether it’s party affiliations of death penalty supporters, the relationship between the size of a fire and the number of fire trucks at the scene, or the likelihood women will wear red when facing a potential mate, Kayser’s lectures are peppered with vivid examples he hopes will give students a “sense of the topography” of what numbers can do.
As to who takes the Bible literally, Kayser says: “Believe it or not, we actually have data on this.”
“Informed consumers of quantitative evidence”
Grappling with the complexities of modern society and the response of public administrations is a challenge many public policy students will face when they enter the workforce. There’s no doubt such skills are in demand. In the United States, for example, the Bureau of Labor Statistics predicts a 34% rise in statistics jobs in the decade to 2024, compared to a 7% rise in job growth overall.
“Kayser has this joke – he calls it the next sexy profession,” says Jordan Strayer, an MPP student from the US. “Everybody wants number-crunchers, if you will, and I definitely think he takes it from the angle that this is (…) going to be really important in the future.”
Kayser, Professor of Applied Methods and Comparative Politics at the Hertie School, says he takes a “notably different” approach to introductory statistics than other instructors. Usually, students spend a lot of time on underlying mathematics. On top of that, he says, most common syllabi for introductory statistics cover only topics up to “bivariate regression” – looking at one independent and one dependent variable.
“That is a largely useless skill, since most variables in the social world are correlated with many others,” Kayser says. “We spend the last four weeks working on multiple regression, with the understanding that, if this is the only course they ever take – and that’s the case for about half of the students in the class, then at least they will have the skill and understanding of what’s probably the most important workhorse of data analysis – multiple regression.”


Jordan Strayer agrees. Instead of just learning how to apply formulas, he says, “Kayser definitely makes it applicable to things that might impact people in their day-to-day lives.”
Although a good number of his students won’t pursue data analysis any deeper than ‘Statistics 1’, especially if they work for a public ministry or an NGO, "a lot of them later in their careers will be exposed to reports done by more quantitative analysts,” says Kayser. “They will have to understand how much credibility to attach to different findings and ask, ‘Was this the right type of analysis – what would happen if they omitted a necessary variable in the specification?’”
“The idea is that even if they do not become data analysts themselves, they will at least be informed consumers of quantitative evidence,” says Kayser.
Cheese consumption and death by entanglement in bedsheets
Of course, he does cover the usual canon, like descriptive statistics – how to efficiently describe patterns in data; the rules of probability – from coin flipping to conditional probability; statistical inference – assessing the probability that observed results might have emerged due to random sampling error; hypothesis testing – distinguishing meaningful effects from those attributable to random variation ; and cross-tabs and regression – estimating the substantive effect of given variables on others.
Among Kayser's personal favourites are situations in which naïve interpretation of the data can be misleading. Spurious relationships can be amusing: “Cheese consumption and death by entanglement in bedsheets…I love all these spurious correlations that you can talk about when you start to address causality,” he says. But assessing causality is also essential to understanding the real world.
Kayser's main goal is for students to gain an understanding of data-driven, or fact-based, policymaking.
Keep calm and find the statistical significance
Real-world examples and a clear, unruffled approach to explaining difficult concepts are just two reasons students give the political scientist top marks for his teaching. And there's even a bit of stand-up comedy to lighten up some pretty heavy ideas.
"'This is going to get ugly," says Kayser, explaining a mind-twisting "three-way cross-tab with layers" in his lecture. "What's the name of those Russian dolls that fit inside each other?"
Or: "Here's a scary formula," he warns his students, chalking the chi-squared formula on the board.
To explain binomial probability, Kayser uses a social psychology experiment based on scientific research that the colour red raises attraction to the opposite sex. "Do women strategically - subconsciously - choose to wear red when they think they have a greater chance of attracting a man?"
Half the women in a job-interview experiment knew beforehand they'd be meeting a conventionally attractive male interviewer and the other half knew they'd be interviewed by one who was substantially less attractive. "In my nightmare scenario, he's going to show up in a class here," Kayser says, putting up the slide of "Bill", whose biceps were - beyond any statistical doubt - smaller than "Matt's".
"Now the boring part - here come the statistics," Kayser says, "Many more wore red in the sample with Matt. The four-condition chi square was 15.8, which means that the overall pattern probably didn't happen randomly." The binomial probability shows that the low frequency of red on women meeting the unattractive man would happen by random chance only 2.3 times in a thousand, he adds.
“I think he honestly enjoys it – he has fun when he’s up there – he has a big smile on his face.”
Carolina Matamoros Ferro says she always struggled to explain such phenomena in simple terms. “It has been amazing seeing Kayser do it. When I was working before coming here, one of the major challenges was to report results to decision-makers (…) Most of them want a simple answer, a straight number or a simple statement and most of the cases are not that straightforward.”
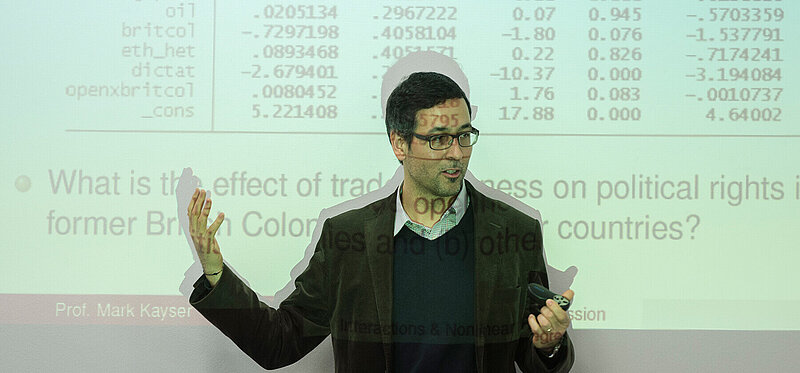
Jordan Strayer says he also admires the fact that Kayser shows that statistical analysis can limit what analysts can claim. In one class, he says, Kayser unsuccessfully tried to prove that a more liberal economy increases political rights. “I liked that example because it was about what statisticians do – they have something they want to prove (…) and they keep trying all these different ways, manipulating their data to get what they want. I don’t think professors would typically show those results.”
Kayser’s class is more than just a requirement, it’s also immensely popular, students say. There’s anecdotal evidence that Kayser also enjoys it: “He has fun when he’s up there – he has a big smile on his face,” Strayer says. Maybe he has some data to prove that too.
